
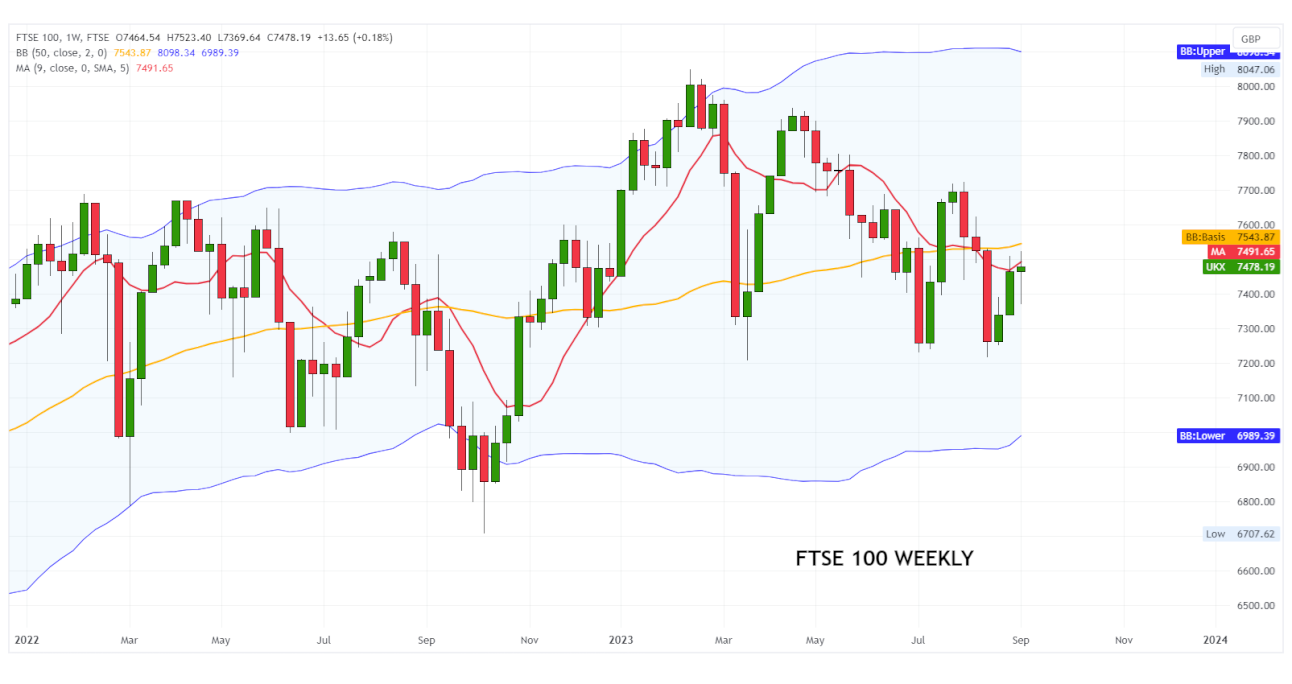
The FTSE 100 index (reference benchmark of the British stock market), after having risen towards mid-February to an intermediate peak of 8,050 points, underwent a rapid correction that pushed prices close to the important static support situated at 7,200 points.
Copyright DMF New Media – ETFWorld.co.uk
Reproduction prohibited in any form, even partial
The holding of this last level is important as it can halt the descent and favour the construction of a solid accumulation base, an indispensable premise for starting a solid upward movement.
Any recovery will however have to face a first resistance at 7,625 and a second barrier in the 7,720-7,730 points area.
A return above this area would be positive, even though, from a graphical point of view, only the breakout of 7,800 could provoke a bullish trend reversal and open up interesting areas for growth.

Click on the image to enlarge it.
A daily close below 7,200 points would instead provide a dangerous bearish signal of a directional type, with a first target in the 7,050-7,030 area and a second target near 6,900 points.
Click on the image to enlarge it.
The following ETFs can be used to invest in the UK stock market:
Vanguard Ftse 100, ISIN IE00B810Q511. This ETF has €4,397m in assets under management, physical replication of the underlying and a distribution policy (with dividends being distributed quarterly to investors). The total expense ratio (TER) is 0.09% per annum.
HSBC Ftse 100, ISIN IE00B42TW061. This ETF has assets under management of EUR 567m, which provides for the physical replication of the underlying (via a swap), which adopts a distribution policy (with dividends being distributed semi-annually to investors). The total expense ratio (TER) is 0.07% per annum.
iShares Core Ftse 100, ISIN IE00B53HP851. This ETF has €2,146m in assets under management, physical replication of the underlying and an accumulation policy (with dividends being reinvested within the fund). The total expense ratio (TER) is 0.07% per annum.
Copyright DMF New Media – ETFWorld.co.uk
Reproduction prohibited in any form, even partial
Disclaimer
The contents of these notes and the opinions expressed should in no way be regarded as an invitation to invest. The analyses do not constitute a solicitation to buy or sell any financial instrument.The purpose of these notes is financial analysis and investment research. Where recommendations are made, they are of a general nature, are addressed to an indistinct audience and lack the element of personalisation. Although the result of extensive analysis, the information contained in these notes may contain errors. Under no circumstances can the authors be held liable for any choices made by readers on the basis of such erroneous information.erroneous information. Anyone deciding to carry out any financial transaction on the basis of the information contained in the site does so assuming full responsibility.
Subscribe to Our Newsletter
